Podium Dashboard
A responsive React component library for dashboards, built at Podium.
Description
At Podium, I built and maintained Podium Charts, a design system and library built in React that supports the creation of chart-based dashboards. Specifcally, it was built as an integral part of a modular reporting platform that other teams could use to build their own in-app customer reporting.
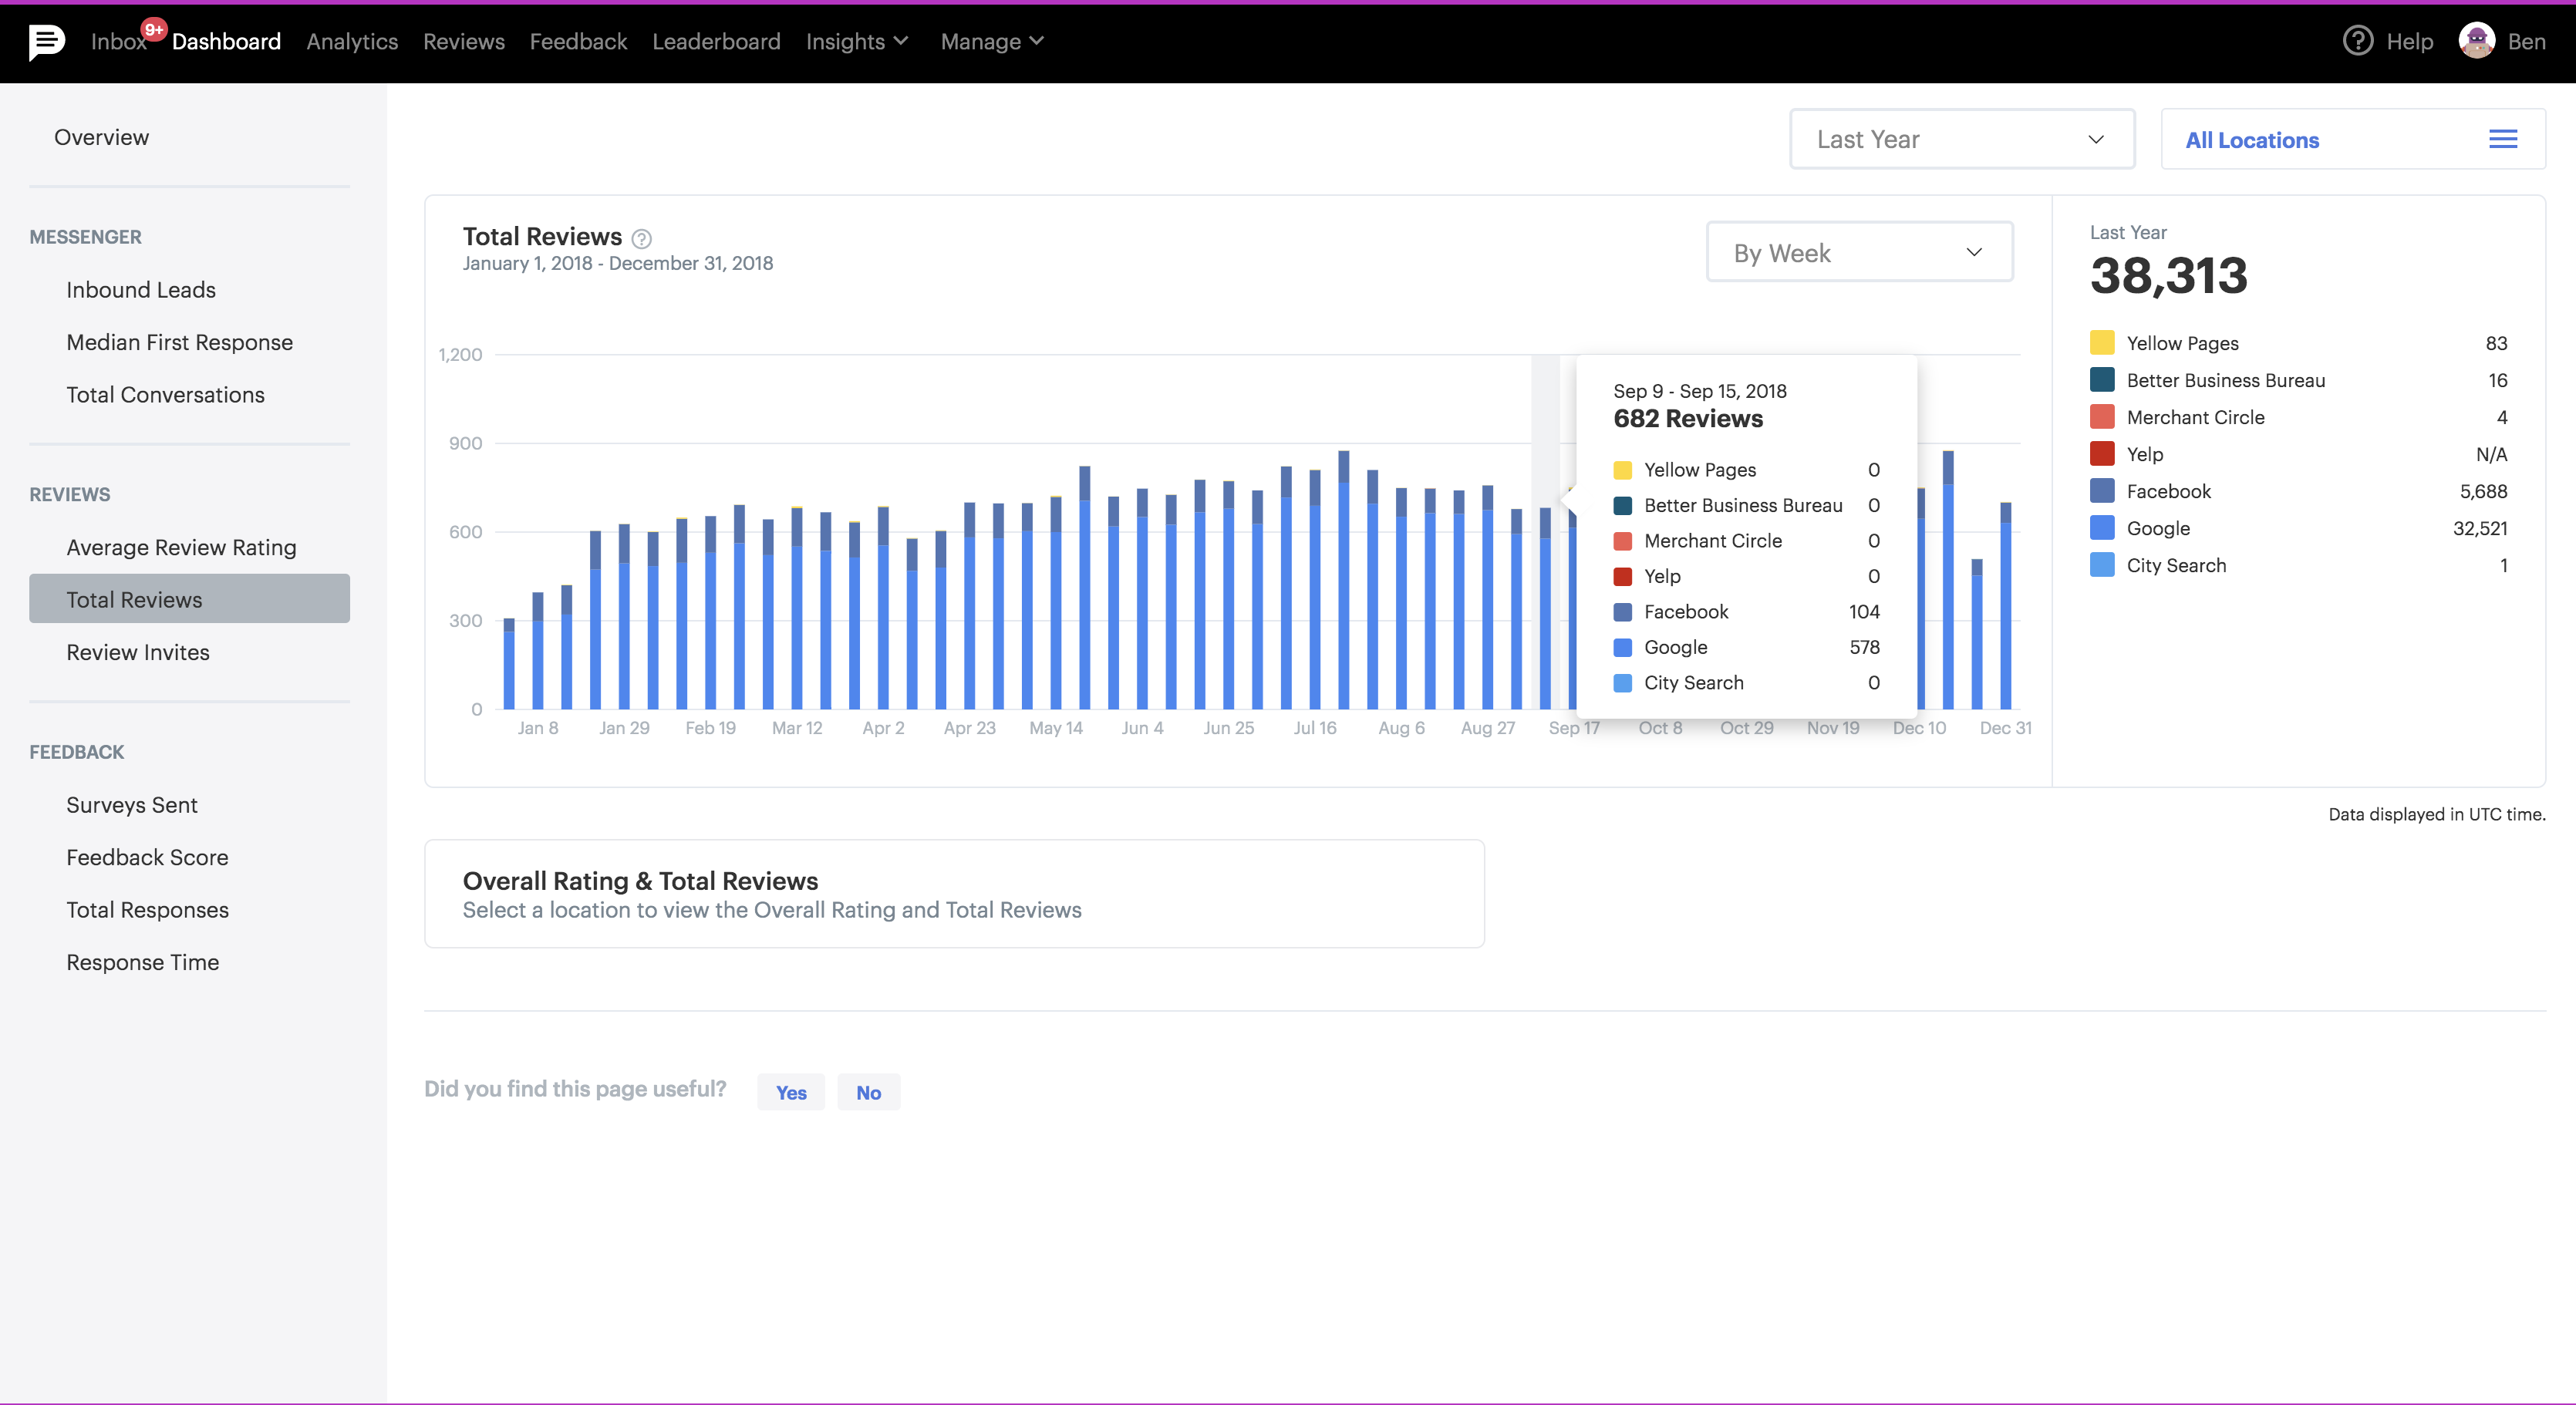
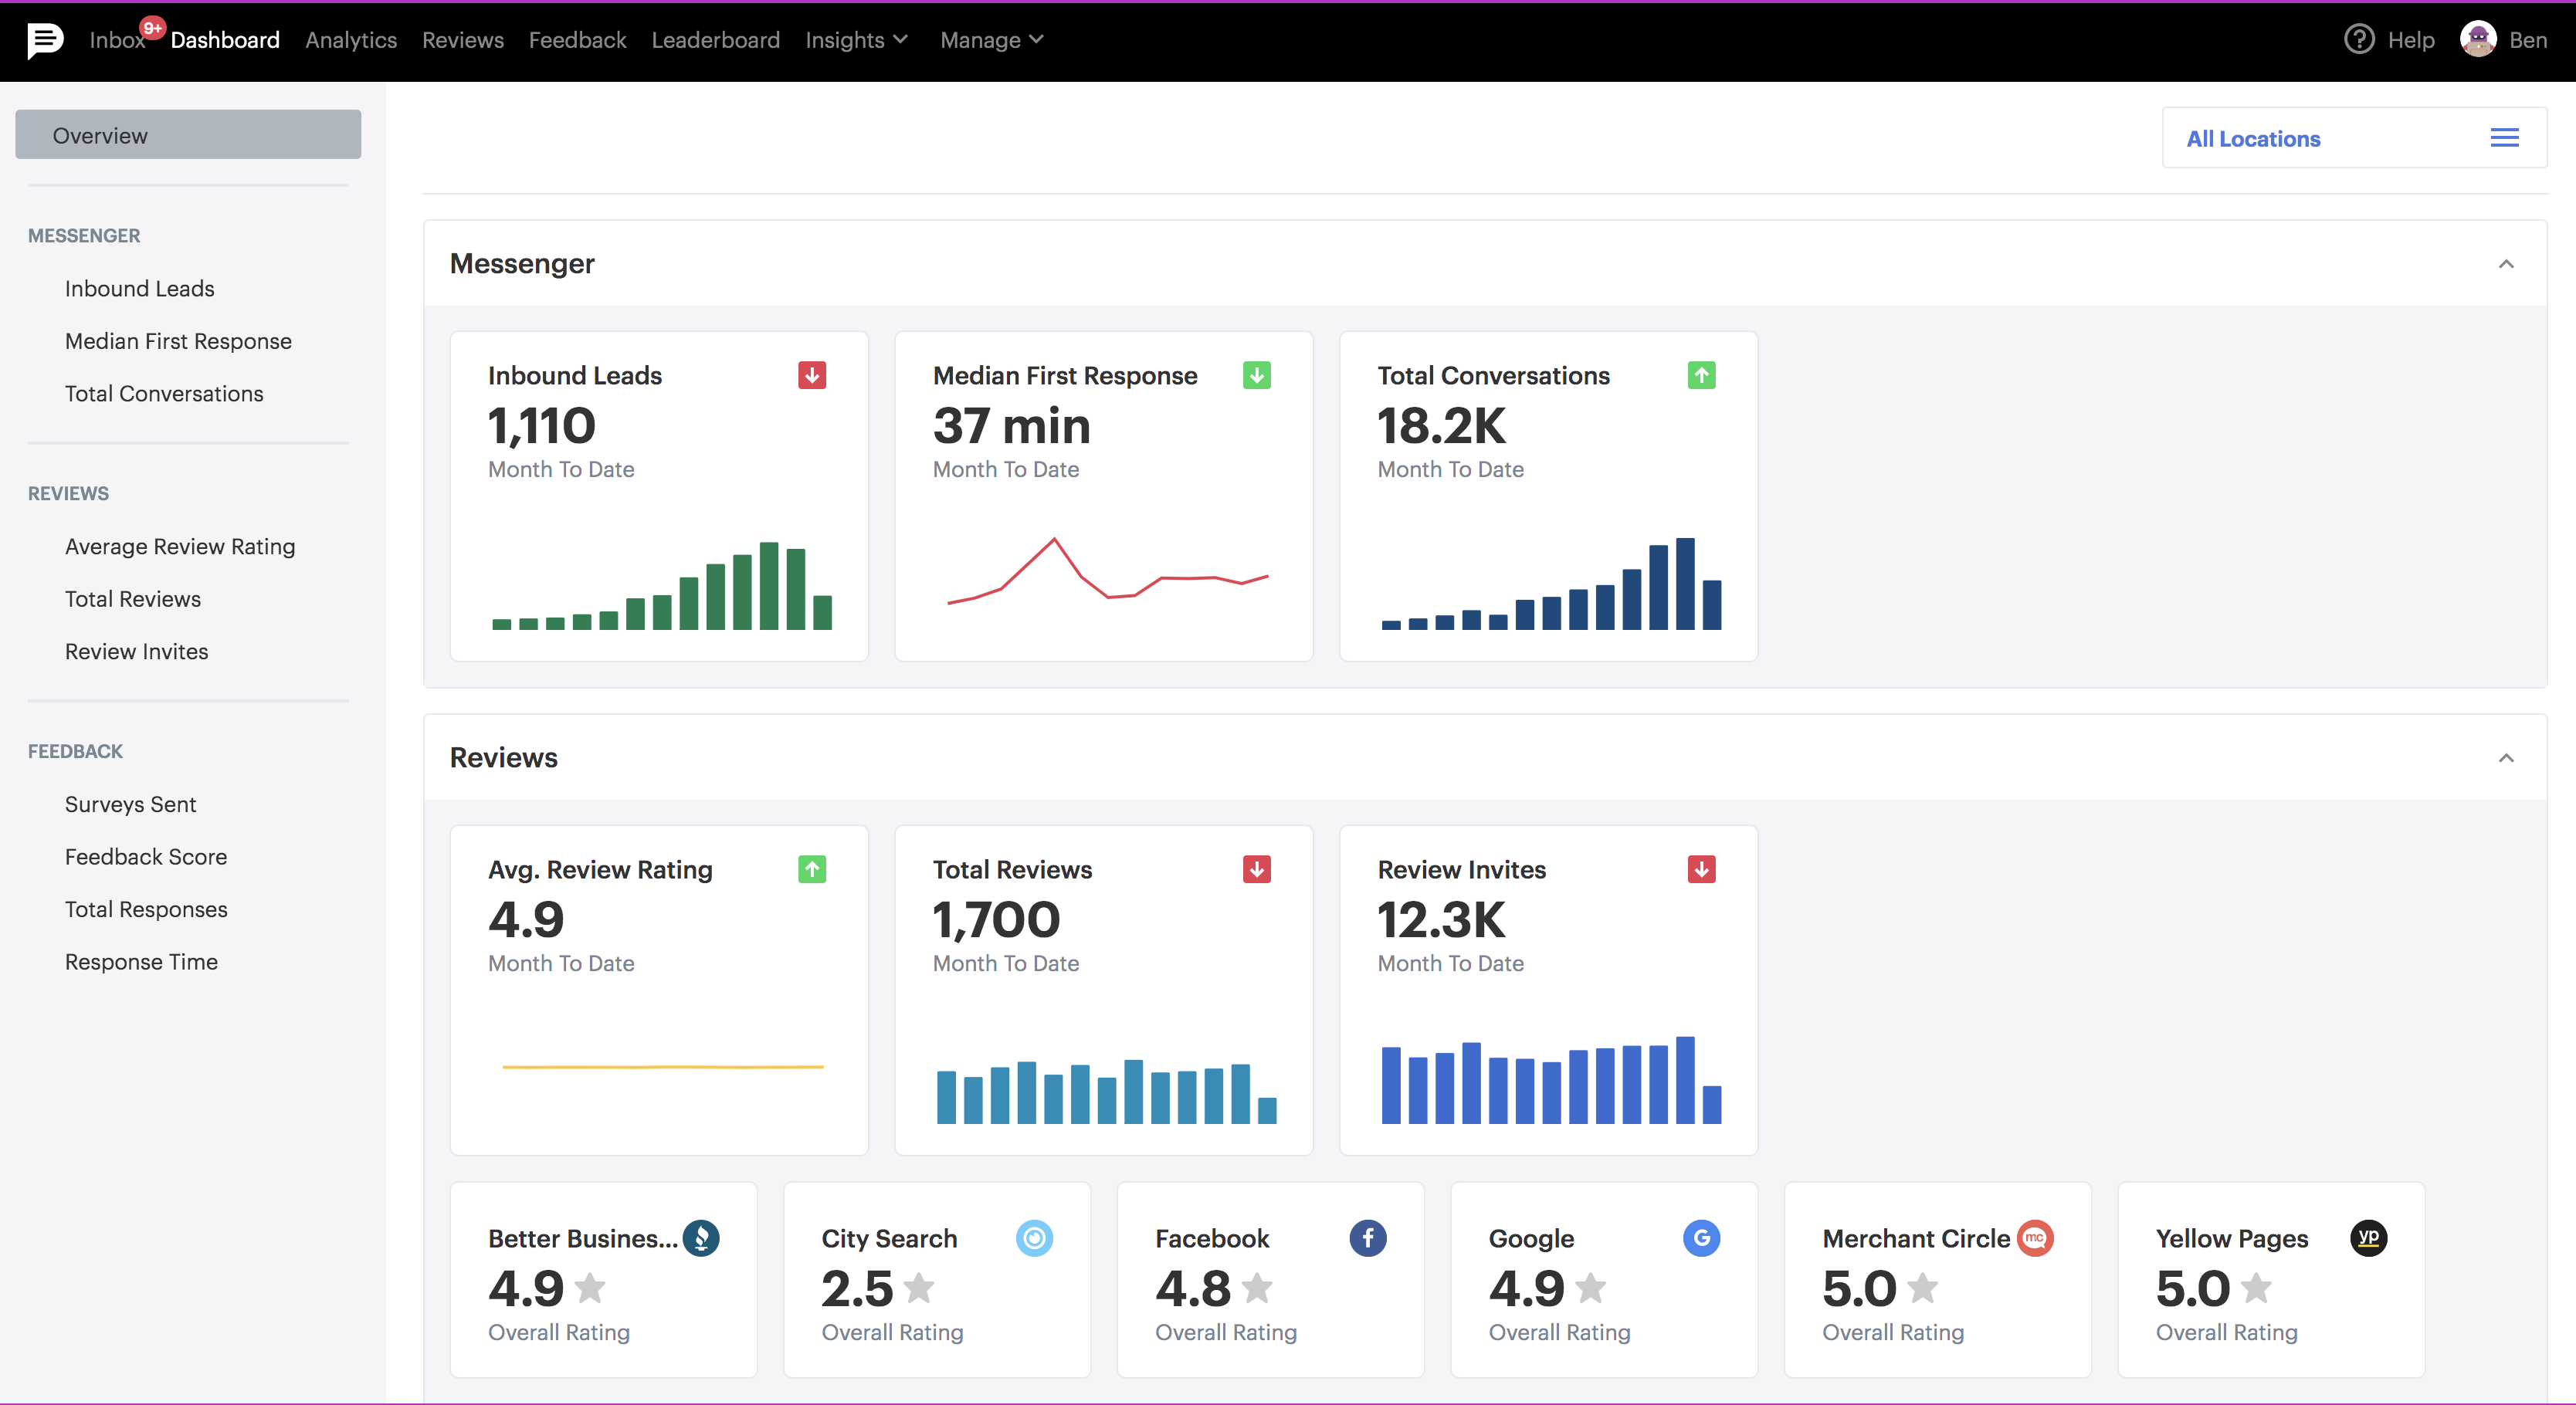
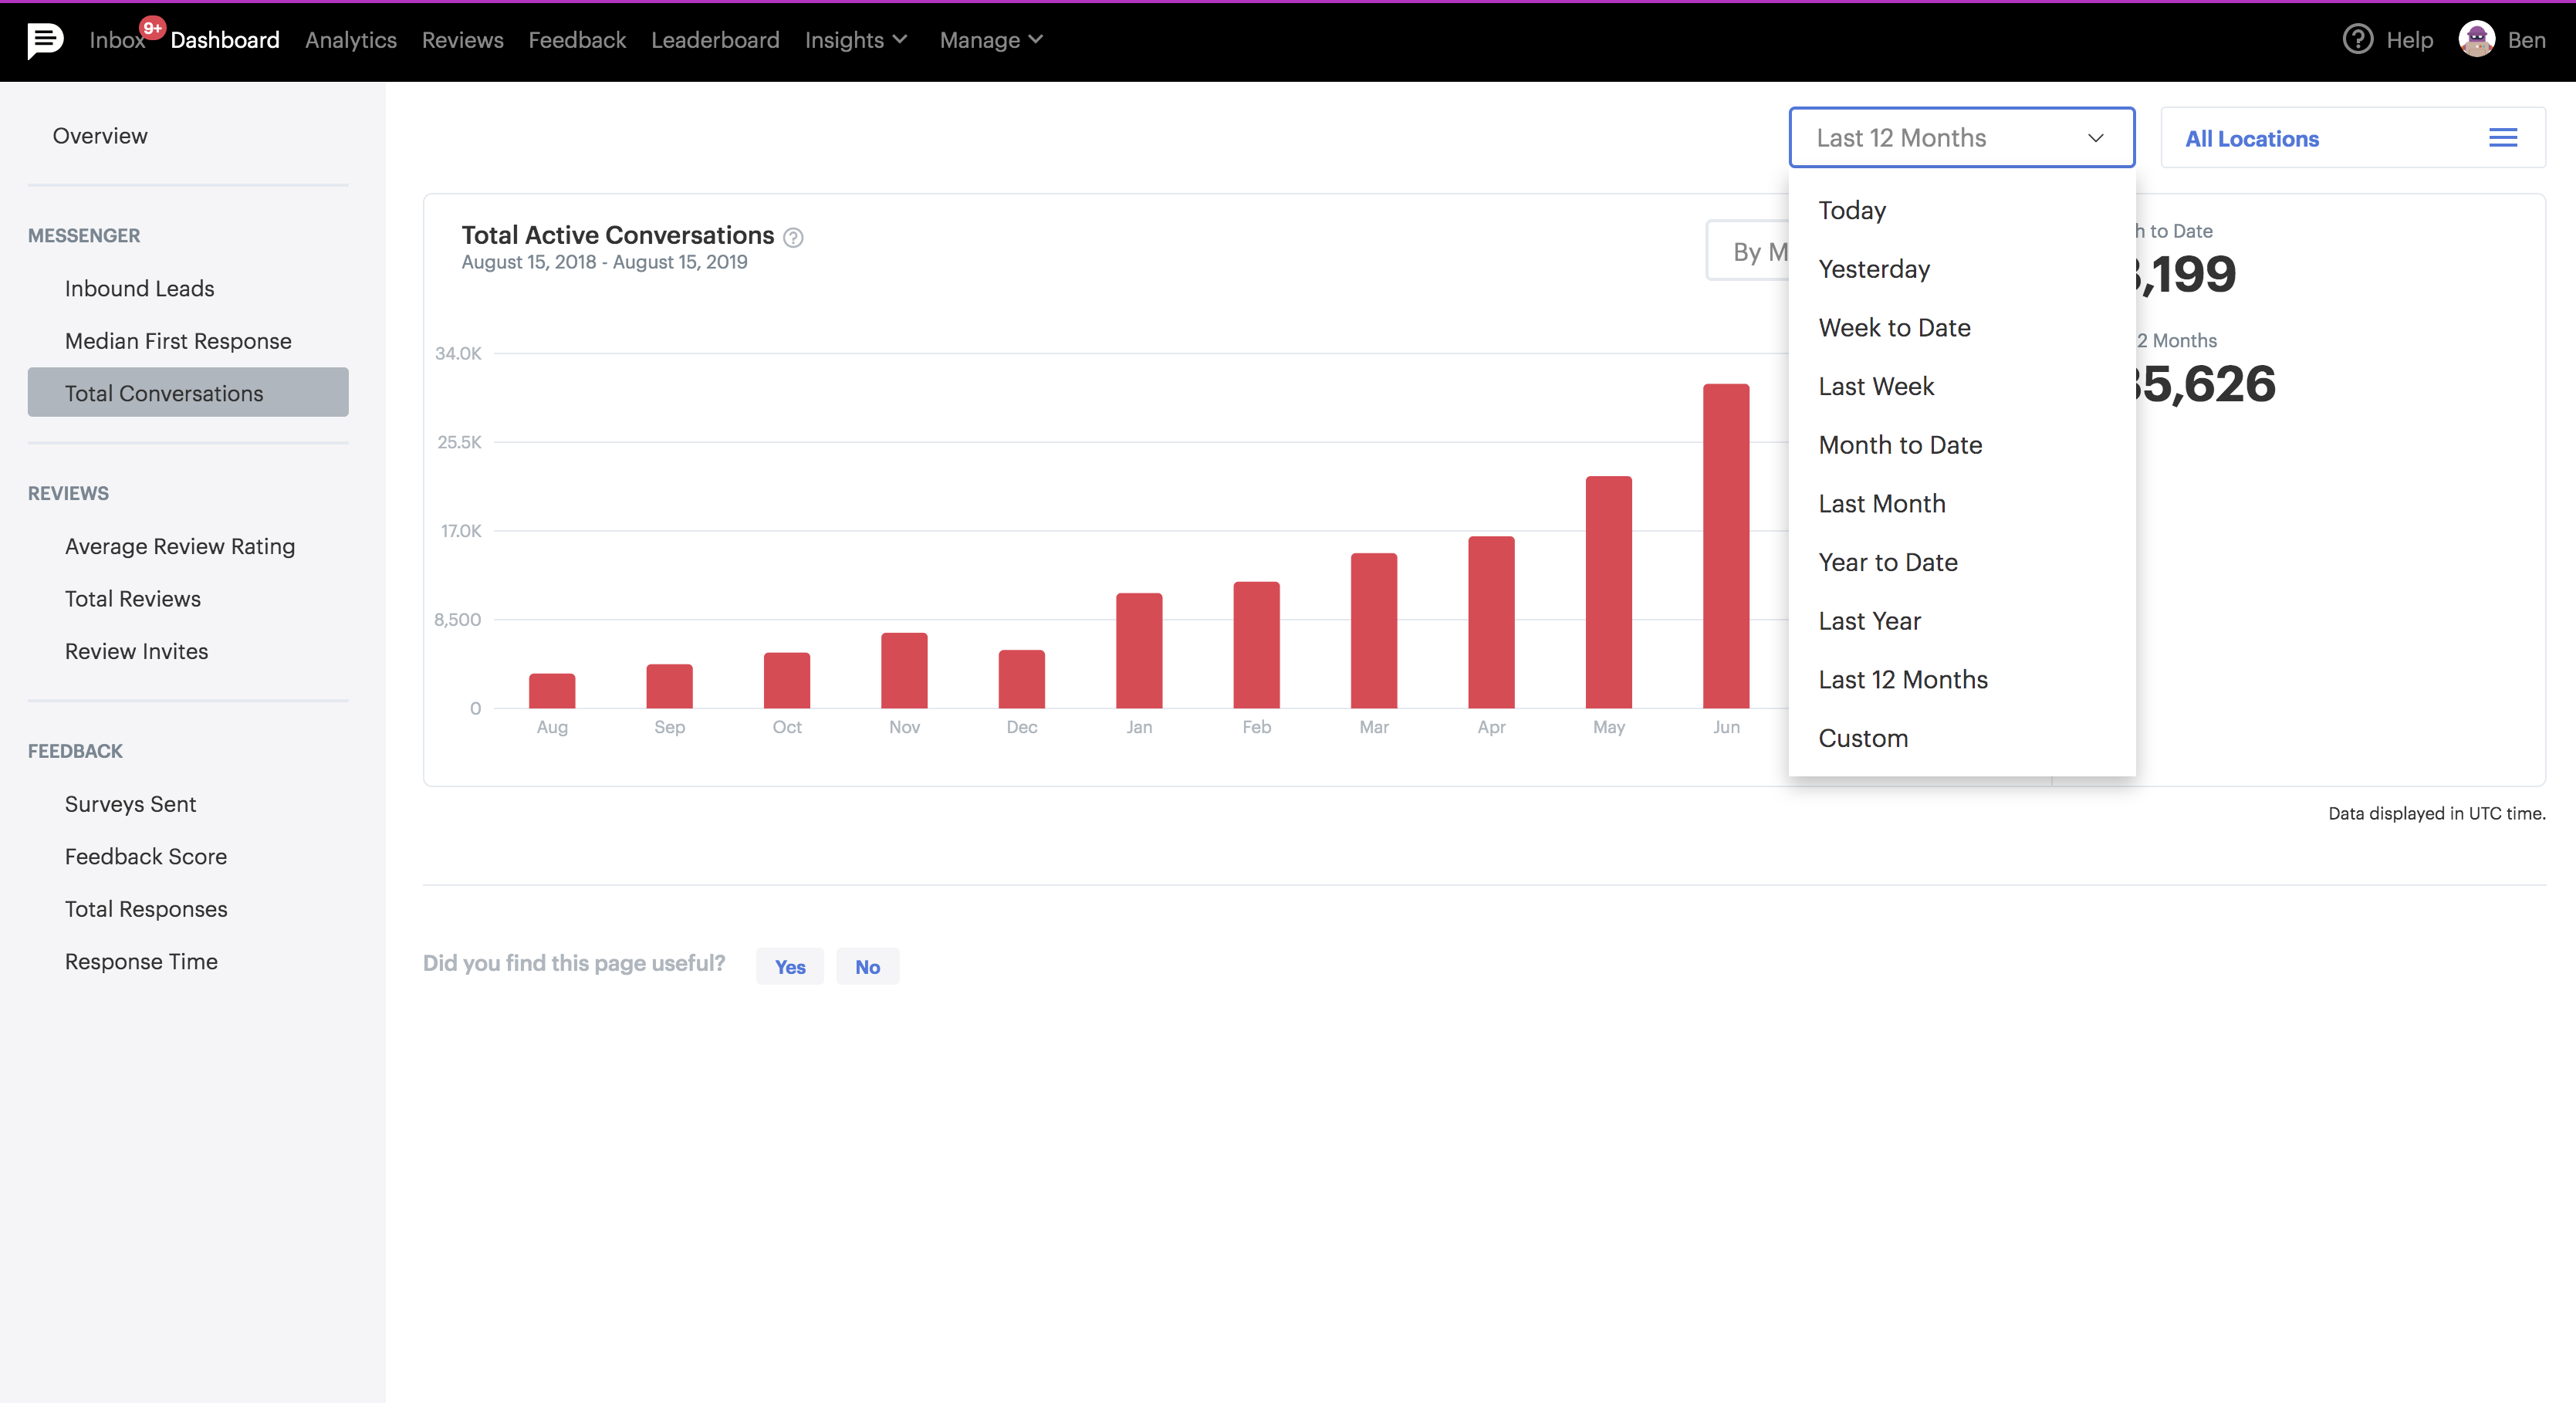
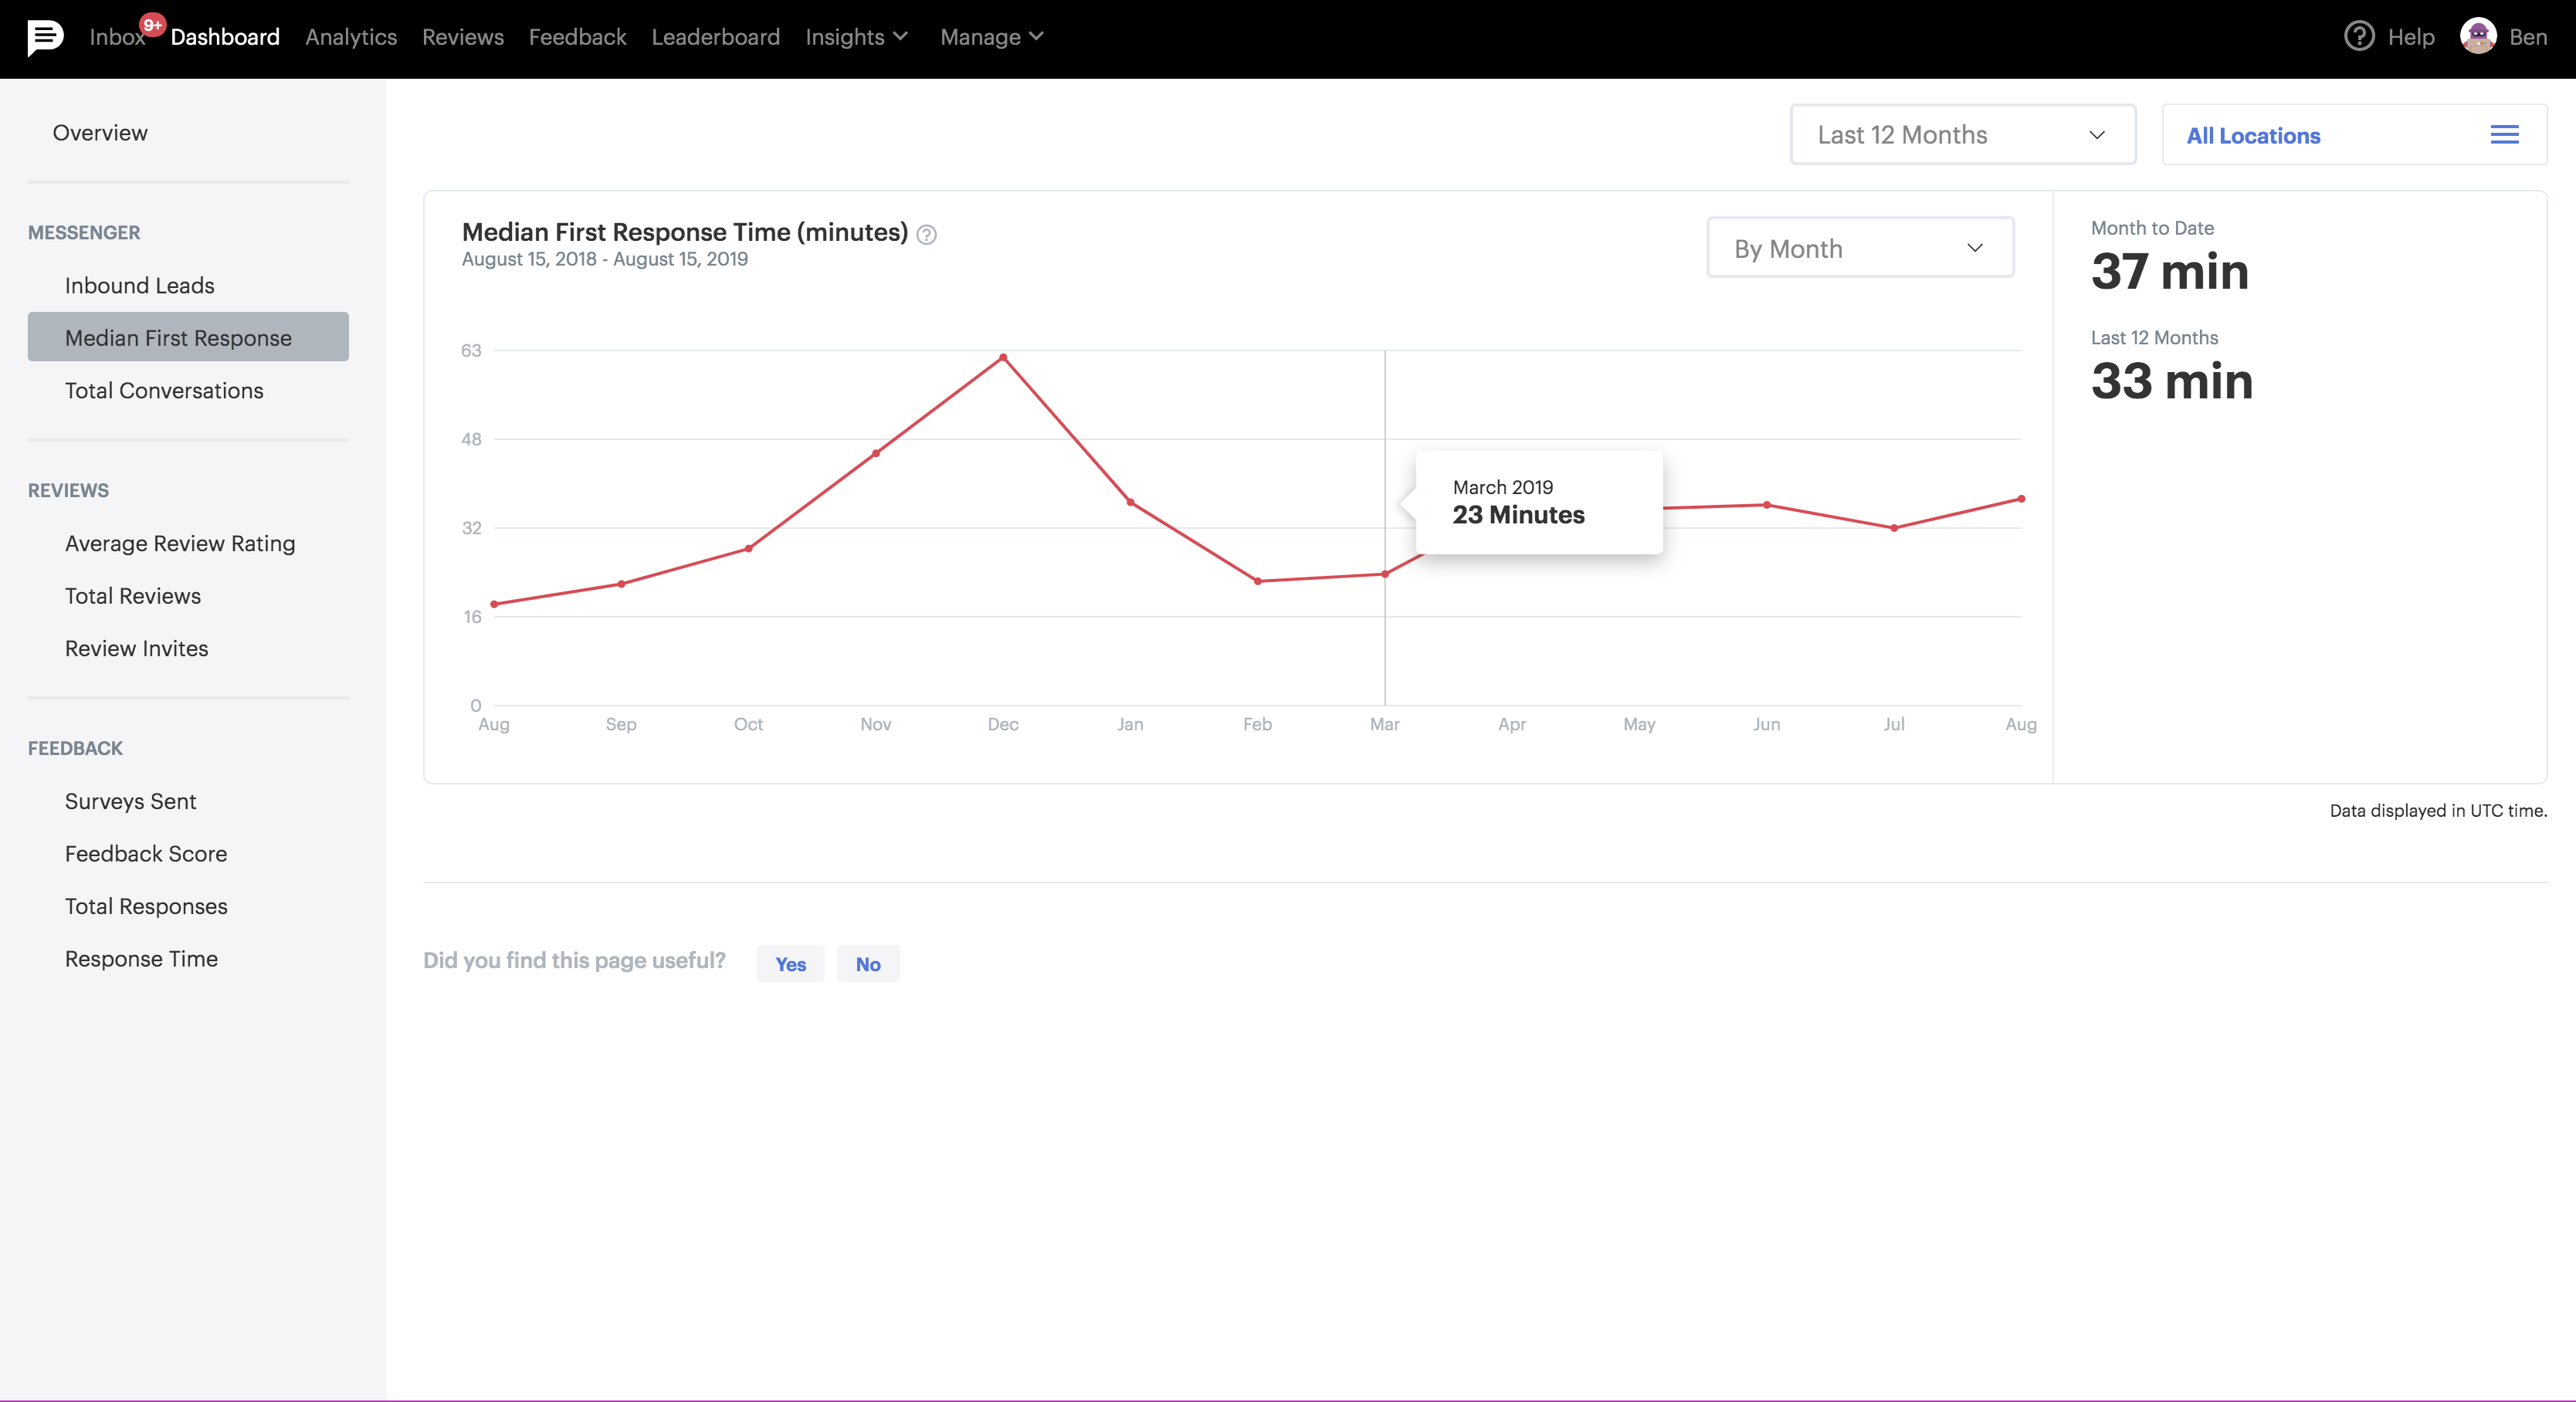
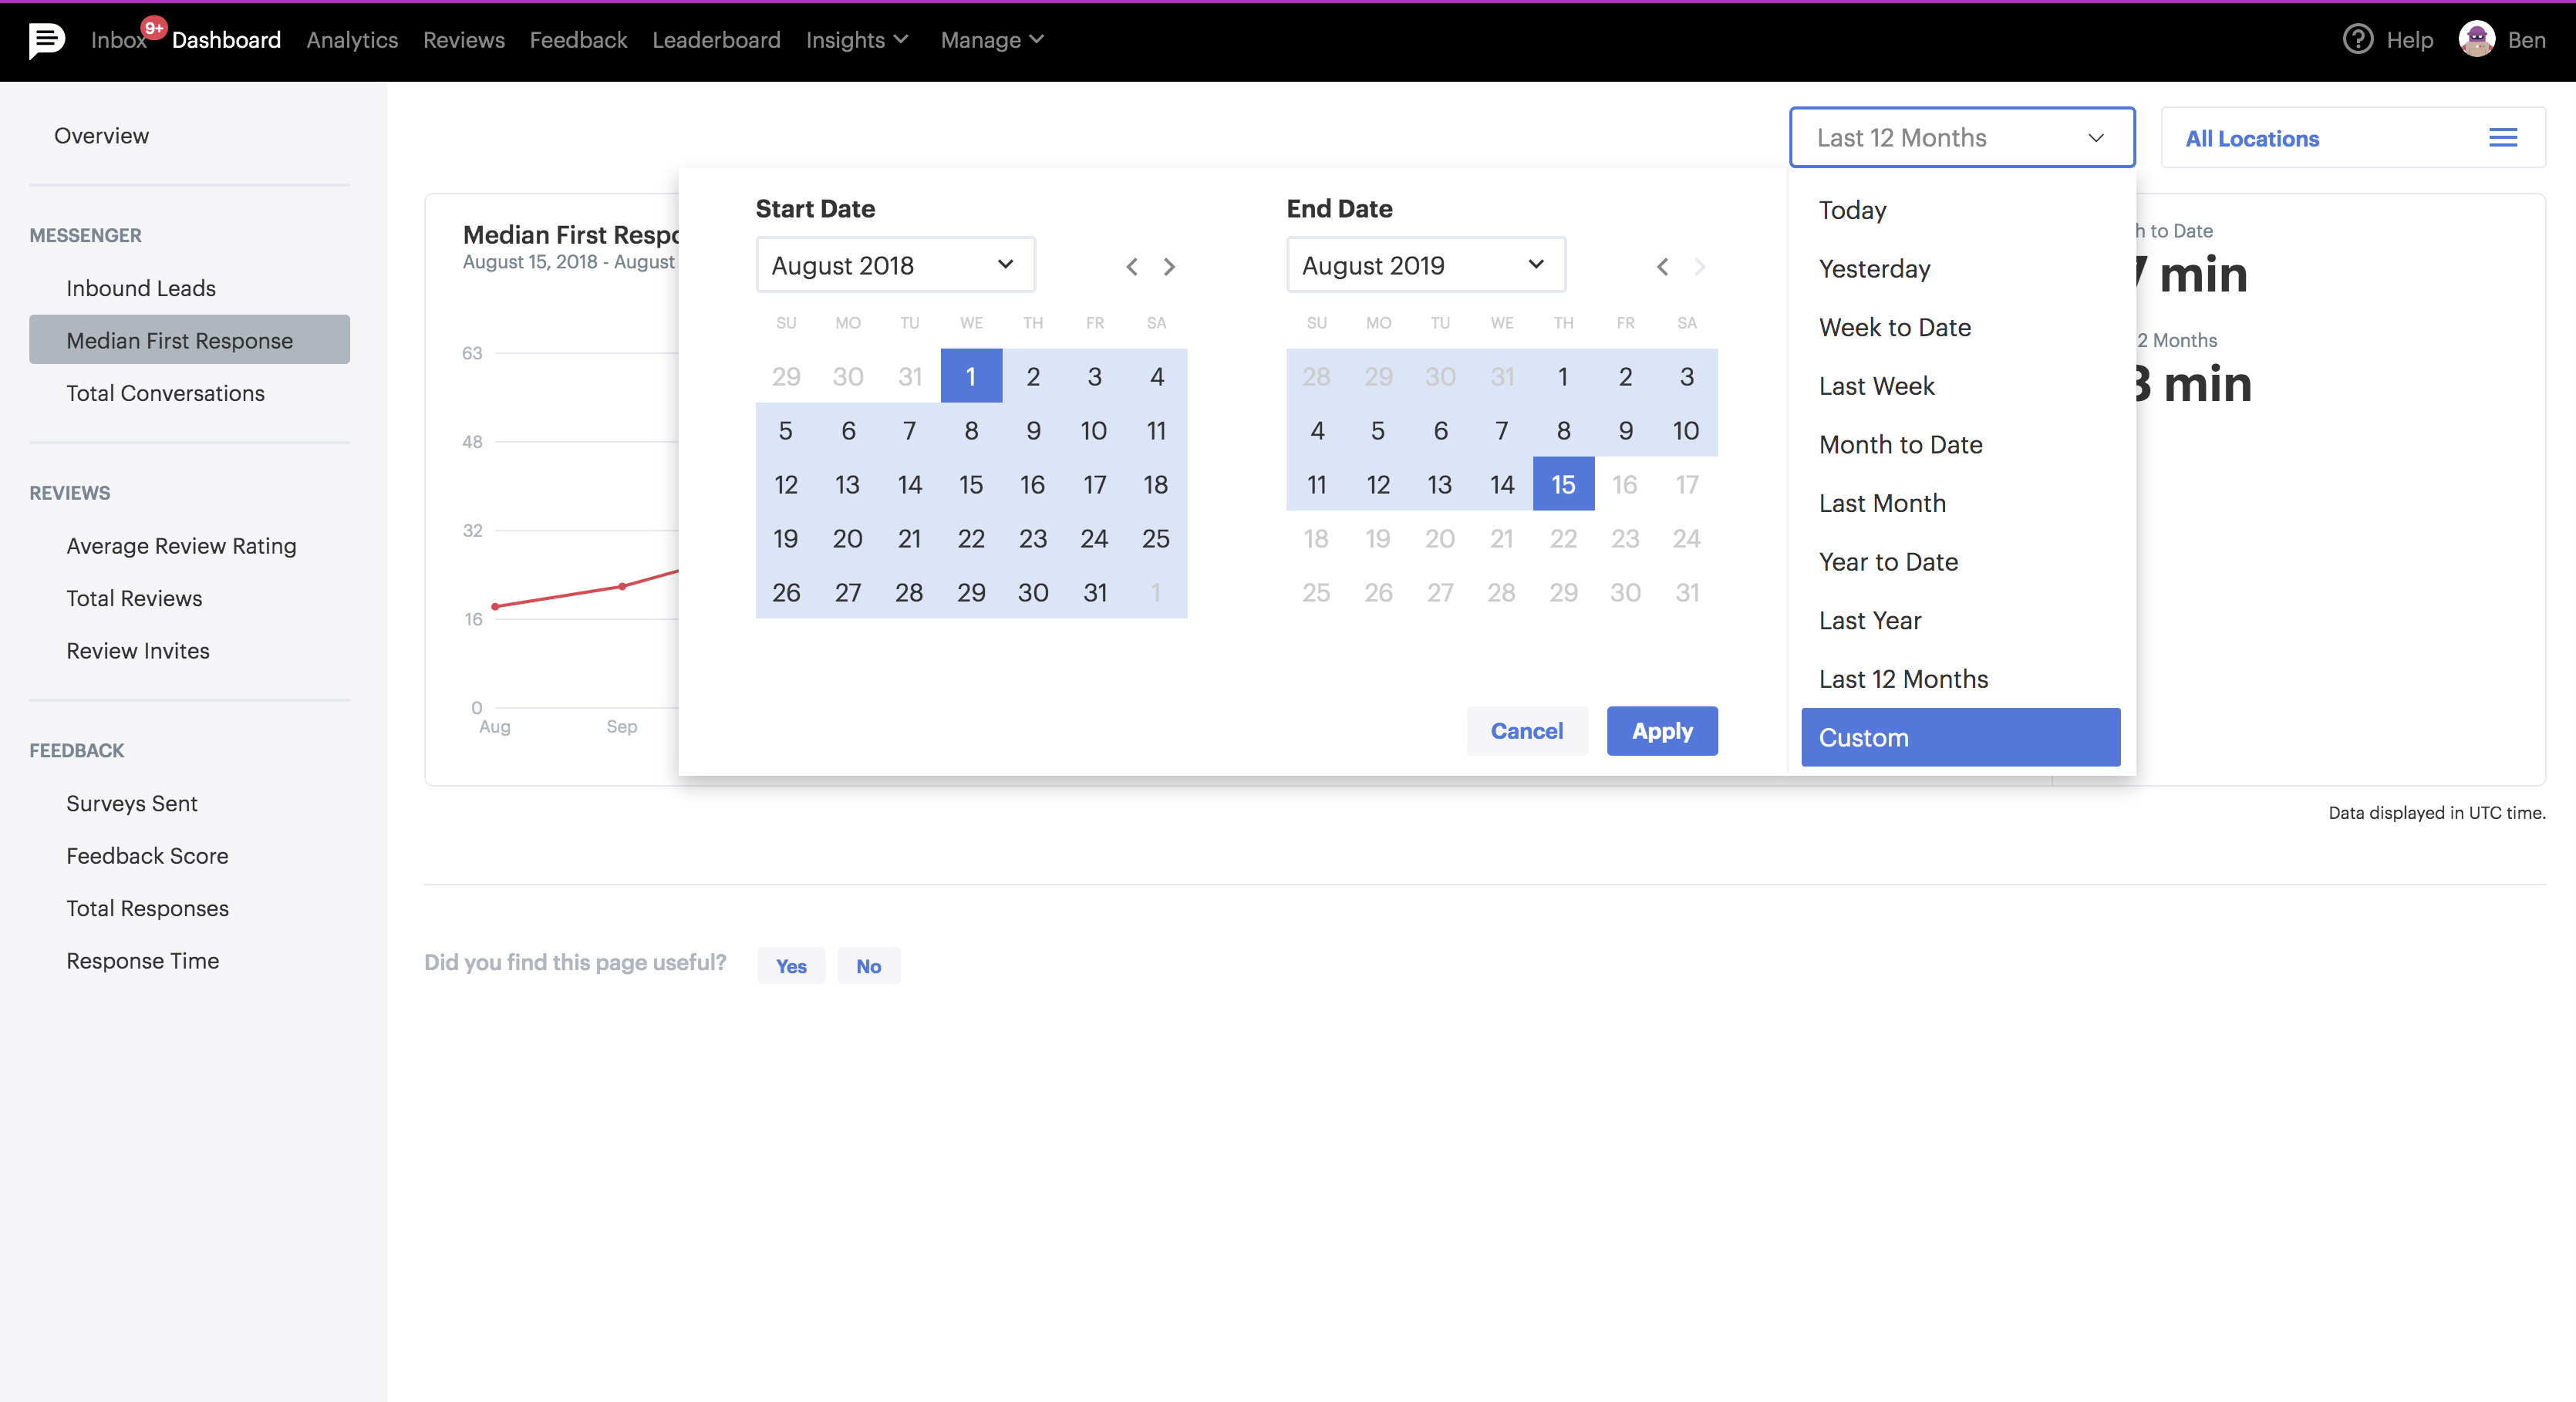
The library is built around Recharts and D3.js and it supports charting, legends, dashboard cards, summaries, time granularities, a calendar select tool, and other custom interactions. Some of the most important charts we supported gave insight into employees’ median first response time, average review rating, and total active conversations.
The Problem
There was a huge need for our customers to learn more about their customers. Additionally, we had customer reporting across four separate pages on the site and in our mobile app. We needed to consolidate reporting into a single dashboard that would support all of our product teams.
Planning
The process of building Podium Charts involved a lot of feedback and requirement gathering as well as input from our team’s designer. We also wanted to integrate our solutions into Podium’s existing internal design system. The calendar component I built from scratch was eventually incorporated into Podium’s general design system for use across our apps.
As a team, we decided that the project would start with three teams which whose reporting we would implement ourselves, including the back end data pipeline built on Kafka and Elasticsearch. I supported the front end during this time, but also worked on the back end as a full stack developer.
User Stories
Here are some user stories that motivated the dashboard library.
Michelle
- Michelle (28) is a full stack software engineer at Podium who needs to build custom reporting for a payments product
- As a fintech developer, she wants a tool that’s resilient to the data privacy requirements of financial data, so that she can effectively do her job in a safe way
- Because she is an experienced developer, she wants a tool that is flexible and customizable
Ted
- Ted (21) is a new developer at Podium who has been tasked with building a chart for an internal teamchat feature
- As a new developer, he wants a library that he can pick up quickly, so that he can make an impact in his first month at Podium
- Because he is new, he wants a tool built on React, a familiar language used at the company
Josh
- Josh (42) is a product manager with a strict deadline for a new customer reporting dashboard page
- As a product manager, he wants a library that will make his developers productive, so that they can ship features quickly and iterate on their ideas
- Because he is a user-focused product manager, he wants to be able to preview the charts before the team invested time in their roadmap to developing them so that they effectively suit customer needs
Outcomes
Podium Charts was adopted by three new teams while I was maintaining it, specifically product teams focused on payments, internal chat, and sourcing external leads on customers’ websites. Multiple chart formats were added to amplify our co-workers productivity. The chart was used to consolidate our in-app reporting to a single, modern, performant dashboard page.
